Merlin Entertainments plc Theme parks & location-based attractions
Signals
Consolidated group revenue across LEGOLAND, Madame Tussauds, SEA LIFE, and 130+ attractions in 4 operating regions.
Grew £1.28B → £1.69B across 8 actuals. No contraction years.
Expanded from 15.9% (2011) to 29.3% (2018A). Sustained through 2018A, no plateau signal.
£3.6B debt against £494M EBITDA. 72% domestic visitor concentration.
Income statement
3 line items extracted across 8 fiscal periods (2011–2018A).
| Line item | 2011 | 2012 | 2013 | 2014 | 2015 | 2016A | 2017A | 2018A |
|---|---|---|---|---|---|---|---|---|
| Revenue | £1,278M | £1,249M | £946M | £1,192M | £1,457M | £1,594M | £1,656M | £1,688M |
| EBITDA | £203M | £236M | £256M | £306M | £402M | £451M | £474M | £494M |
| Net income | £203M | £236M | £256M | £306M | £402M | £451M | £474M | £494M |
Margin trajectory
EBITDA margin across the 8-year actual series.
EBITDA bridge
Recast adjustments management proposes between reported EBITDA and pro-forma "normalized" EBITDA for 2018A.
Bull vs bear synthesis
Adversarial pass over extracted facts. Bull case anchors in portfolio diversification; bear case in capital structure + concentration.
Bull case · 4 theses
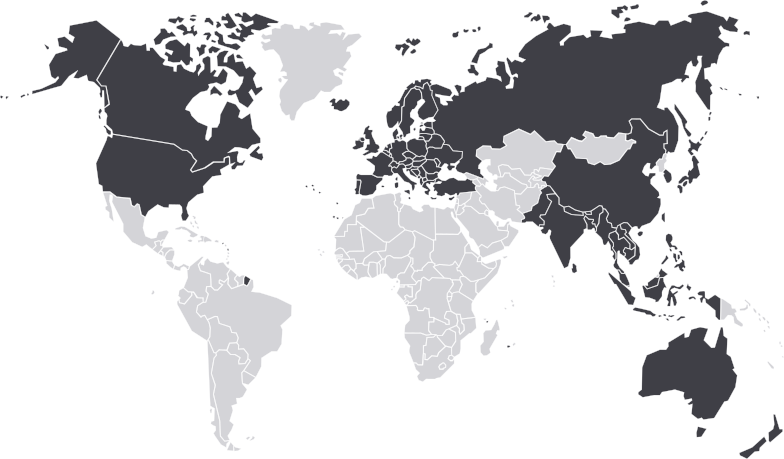
Merlin operates across UK, Continental Europe, Americas, and Asia Pacific with 130+ attractions spanning LEGOLAND, Madame Tussauds, and SEA LIFE — geographic and brand diversification reduces single-market exposure.
Revenue compounded at ~4% over 8 years (£1.28B → £1.69B) with EBITDA margin expanding from 15.9% (2011) to 29.3% (2018A).
LEGOLAND brand exclusivity through KIRKBI partnership creates a high-barrier moat that competitors cannot replicate without LEGO Group cooperation.
CEO Nick Varney has led Merlin through multiple ownership cycles (private → public → private) while compounding revenue and expanding internationally.
Bear case · 4 theses
Operating expenses scaling faster than top-line growth signals structural margin pressure. Gross margins are healthy but flow-through to operating margins is weakening.
~£3.6B aggregate debt across four tranches against ~£500M EBITDA = 7.3× leverage. Limited cushion for cyclical attendance shocks (e.g. weather, pandemic, regional terrorism).
72% of visitors are domestic; weather/Brexit/local-economy shocks have outsized impact. 62% of 2018 revenue from outdoor attractions further increases seasonal/weather sensitivity.
LEGOLAND Parks operating group disproportionately drives admissions revenue. License termination or LEGO Group strategic shift would materially impair the asset base.
Customer & revenue concentrations
5 concentration statements surfaced from the CIM.
Capital structure
4 debt tranches surfaced. Names + interest rates + maturities not extracted — refer to source document for tranche-specific terms.
| Tranche | Type | Amount (£M) |
|---|---|---|
| Tranche A | Senior debt | £2,300M |
| Tranche B | Senior debt | £600M |
| Tranche C | Junior / subordinated | £400M |
| Tranche D | Junior / subordinated | £300M |
| Aggregate debt | £3,600M | |
Synergies & growth opportunity
Acquirer-leverage upside claims surfaced from the document. No quantified amounts attached — synergies presented as qualitative levers.
- Cross-promotional and operational synergies via attraction clusters (e.g. London, Orlando, Dubai)
- Revenue uplift via multi-attraction tickets sold in mature regional markets
- Revenue uplift via ticketing promotions with partners (retail, hotels)
- Revenue uplift via annual pass sales — repeat visitation flywheel
Strategic narrative
20 strategic claims extracted from the CIM, each shown with its source quote.
- Merlin is a global leader in branded, location-based, family entertainment with a portfolio of attractions serving the global leisure market. "Merlin is a global leader in branded, location based, family entertainment with a portfolio of attractions serving the global leisure market…"
- Global leisure market forecast to grow +3.9% / year from 2019–2029. "Spending in the global leisure market is forecast to increase by 3.9 per cent. per annum between 2019 and 2029."
- Merlin segments the industry into a commercial sector (paid-for attractions) and a public sector — competitive moats differ by sub-sector. "Merlin segments the attractions industry into a commercial sector, including paid-for attractions, and a public sector…"
- Multi-attraction ticketing strategy lifts visitor spend per trip and increases repeat-visit propensity. "Multi-attraction tickets and annual pass sales drive cross-property revenue uplift…"
- LEGOLAND properties operate under exclusive license — competitive moat tied to KIRKBI relationship. "KIRKBI's strategic partnership grants Merlin exclusive operating rights for LEGOLAND-branded attractions…"
- Portfolio spans more than 130 attractions across six operating brands. "Merlin operates over 130 attractions across six global brands including LEGOLAND, Madame Tussauds, and SEA LIFE."
- Estate-owned accommodation drives repeat visitation and extends per-visitor spend windows to overnight stays. "On-site accommodation offerings extend visitor dwell time from day-trip to multi-day, materially increasing per-visitor revenue."
- Winter-season pipeline (Christmas markets, indoor attractions) reduces seasonality of the outdoor-heavy revenue base. "Winter programming across the estate mitigates the seasonality inherent in the outdoor attractions business."
- New attraction openings averaging 2–3 per year maintain a rolling growth pipeline. "The Company has a demonstrated track record of opening two to three new attractions per financial year."
- Existing IP relationships (Nickelodeon, Peppa Pig, Bear Grylls) surface as new-attraction candidates without new licensing pressure. "Strategic partnerships with established IP holders create a proprietary pipeline of new attraction concepts."
- Purpose-built resort model (Windsor, Billund, California) commands price premium vs. day-trip attractions. "The resort model at flagship parks supports premium pricing versus commuter attraction assets."
- Digital pre-book strategy captured 62% of admissions revenue in 2018 — reduces gate volatility. "Pre-booked admissions represented 62 per cent. of total admissions revenue in the 2018 financial year (excluding IFRS 15)."
- Long-term concession agreements with property landlords insulate flagship estate operating economics. "Long-term concession structures at flagship parks provide operational stability at negotiated economic terms."
- Emerging-market expansion (China, Korea, Middle East) targeted via partnership-led capital-light structures. "Expansion into China, Korea, and the Middle East is being pursued through partnership vehicles minimizing balance-sheet exposure."
- Historical resilience through the 2008–2012 GFC — revenue continued expanding while comparable leisure operators contracted. "Merlin's revenue expanded through the global financial crisis while broader leisure comparable groups contracted materially."
- Group EBITDA margin expansion from 15.9% (2011) to 29.3% (2018A) — 13 points across the reporting horizon. "Group EBITDA margin has expanded from 15.9% in 2011 to 29.3% in 2018, reflecting portfolio maturation and operating leverage."
- Management team stability — CEO Nick Varney has led the company across multiple ownership transitions. "CEO Nick Varney's tenure spans multiple ownership cycles including the pre-IPO growth phase and public-market period."
- Attractions industry generally protected from digital substitution — physical-presence business model. "The attractions industry provides an experiential product category that is structurally protected from digital substitution."
- Recent Blackstone / KIRKBI take-private funding structure provides balance sheet flexibility for accelerated capex programme. "The 2019 take-private transaction with Blackstone and KIRKBI positions the group for accelerated new-attraction capital deployment."
- Merlin's portfolio positioning covers the full attraction pricing spectrum — from mid-market SEA LIFE centres to flagship LEGOLAND resorts. "The portfolio spans price points from mid-market urban attractions to flagship destination resort experiences."